-
Dwarf Mistletoe, Life cycle
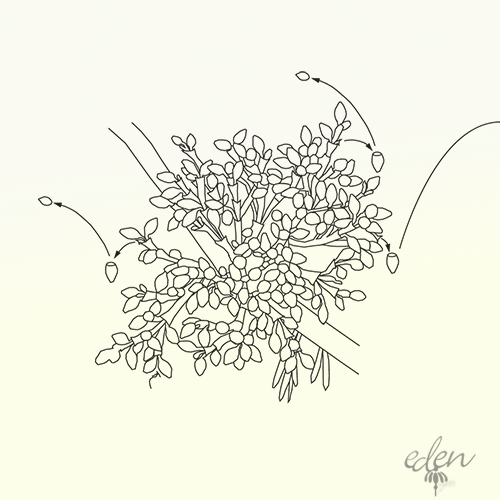
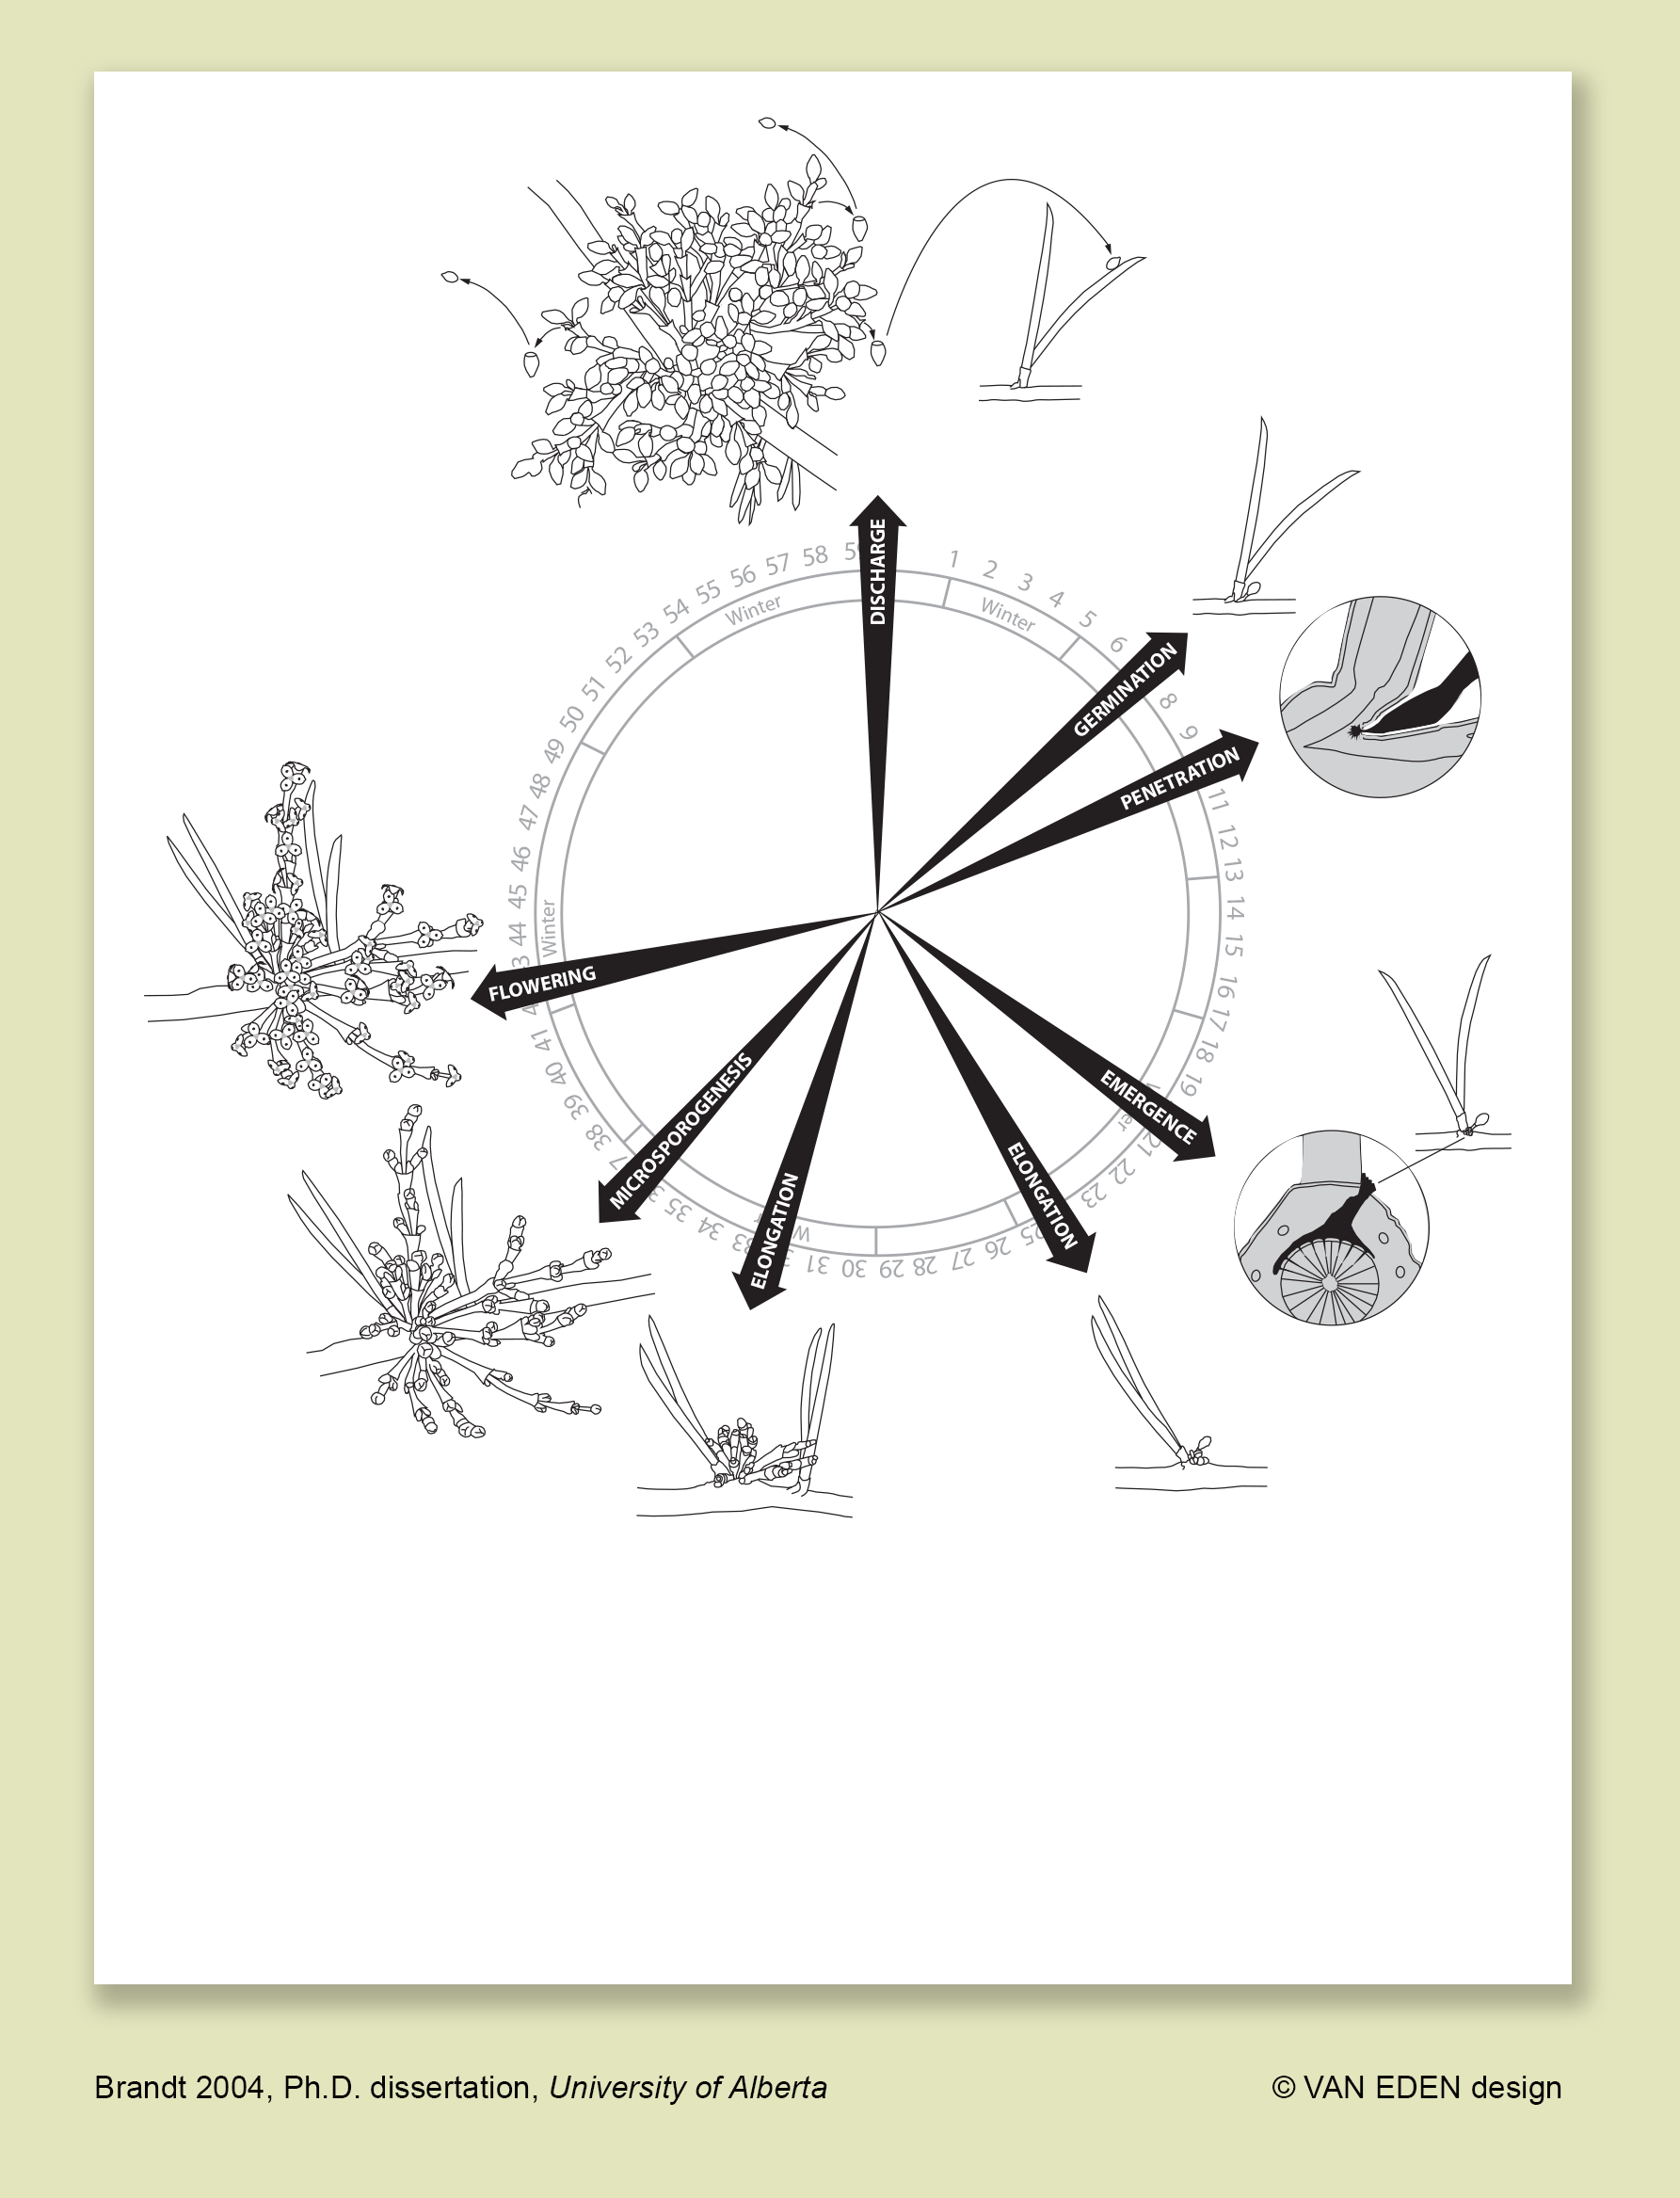
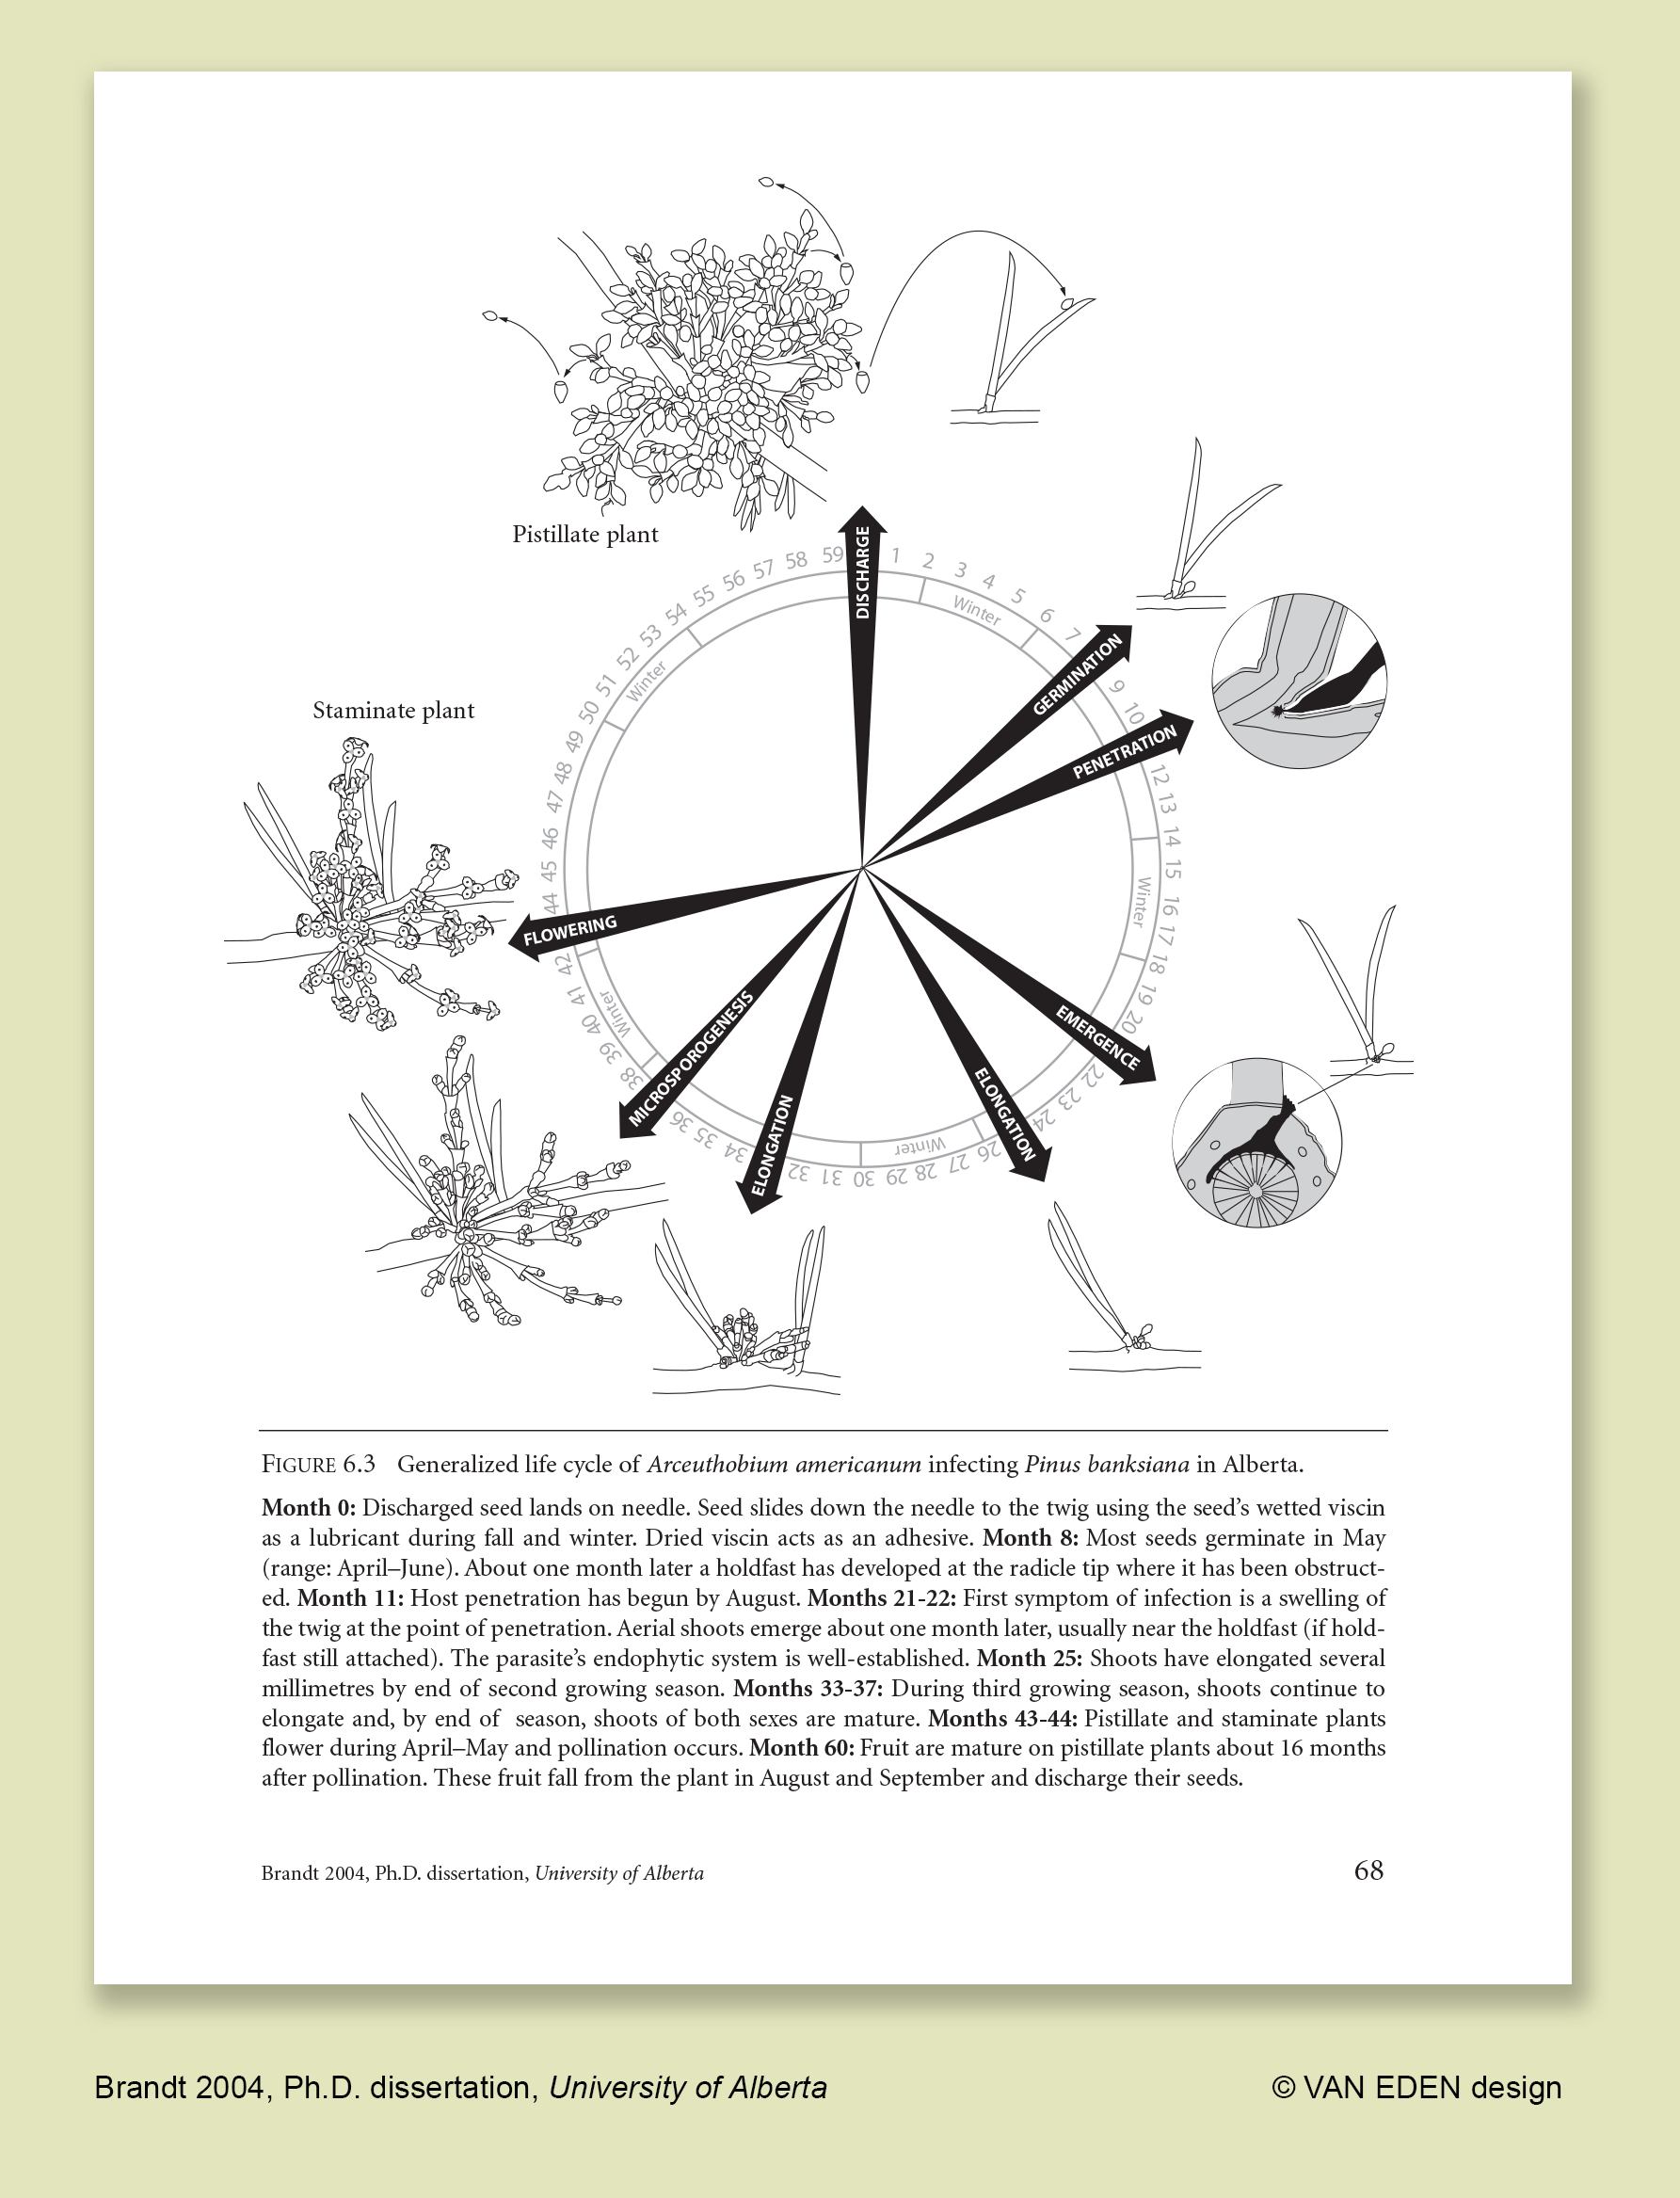
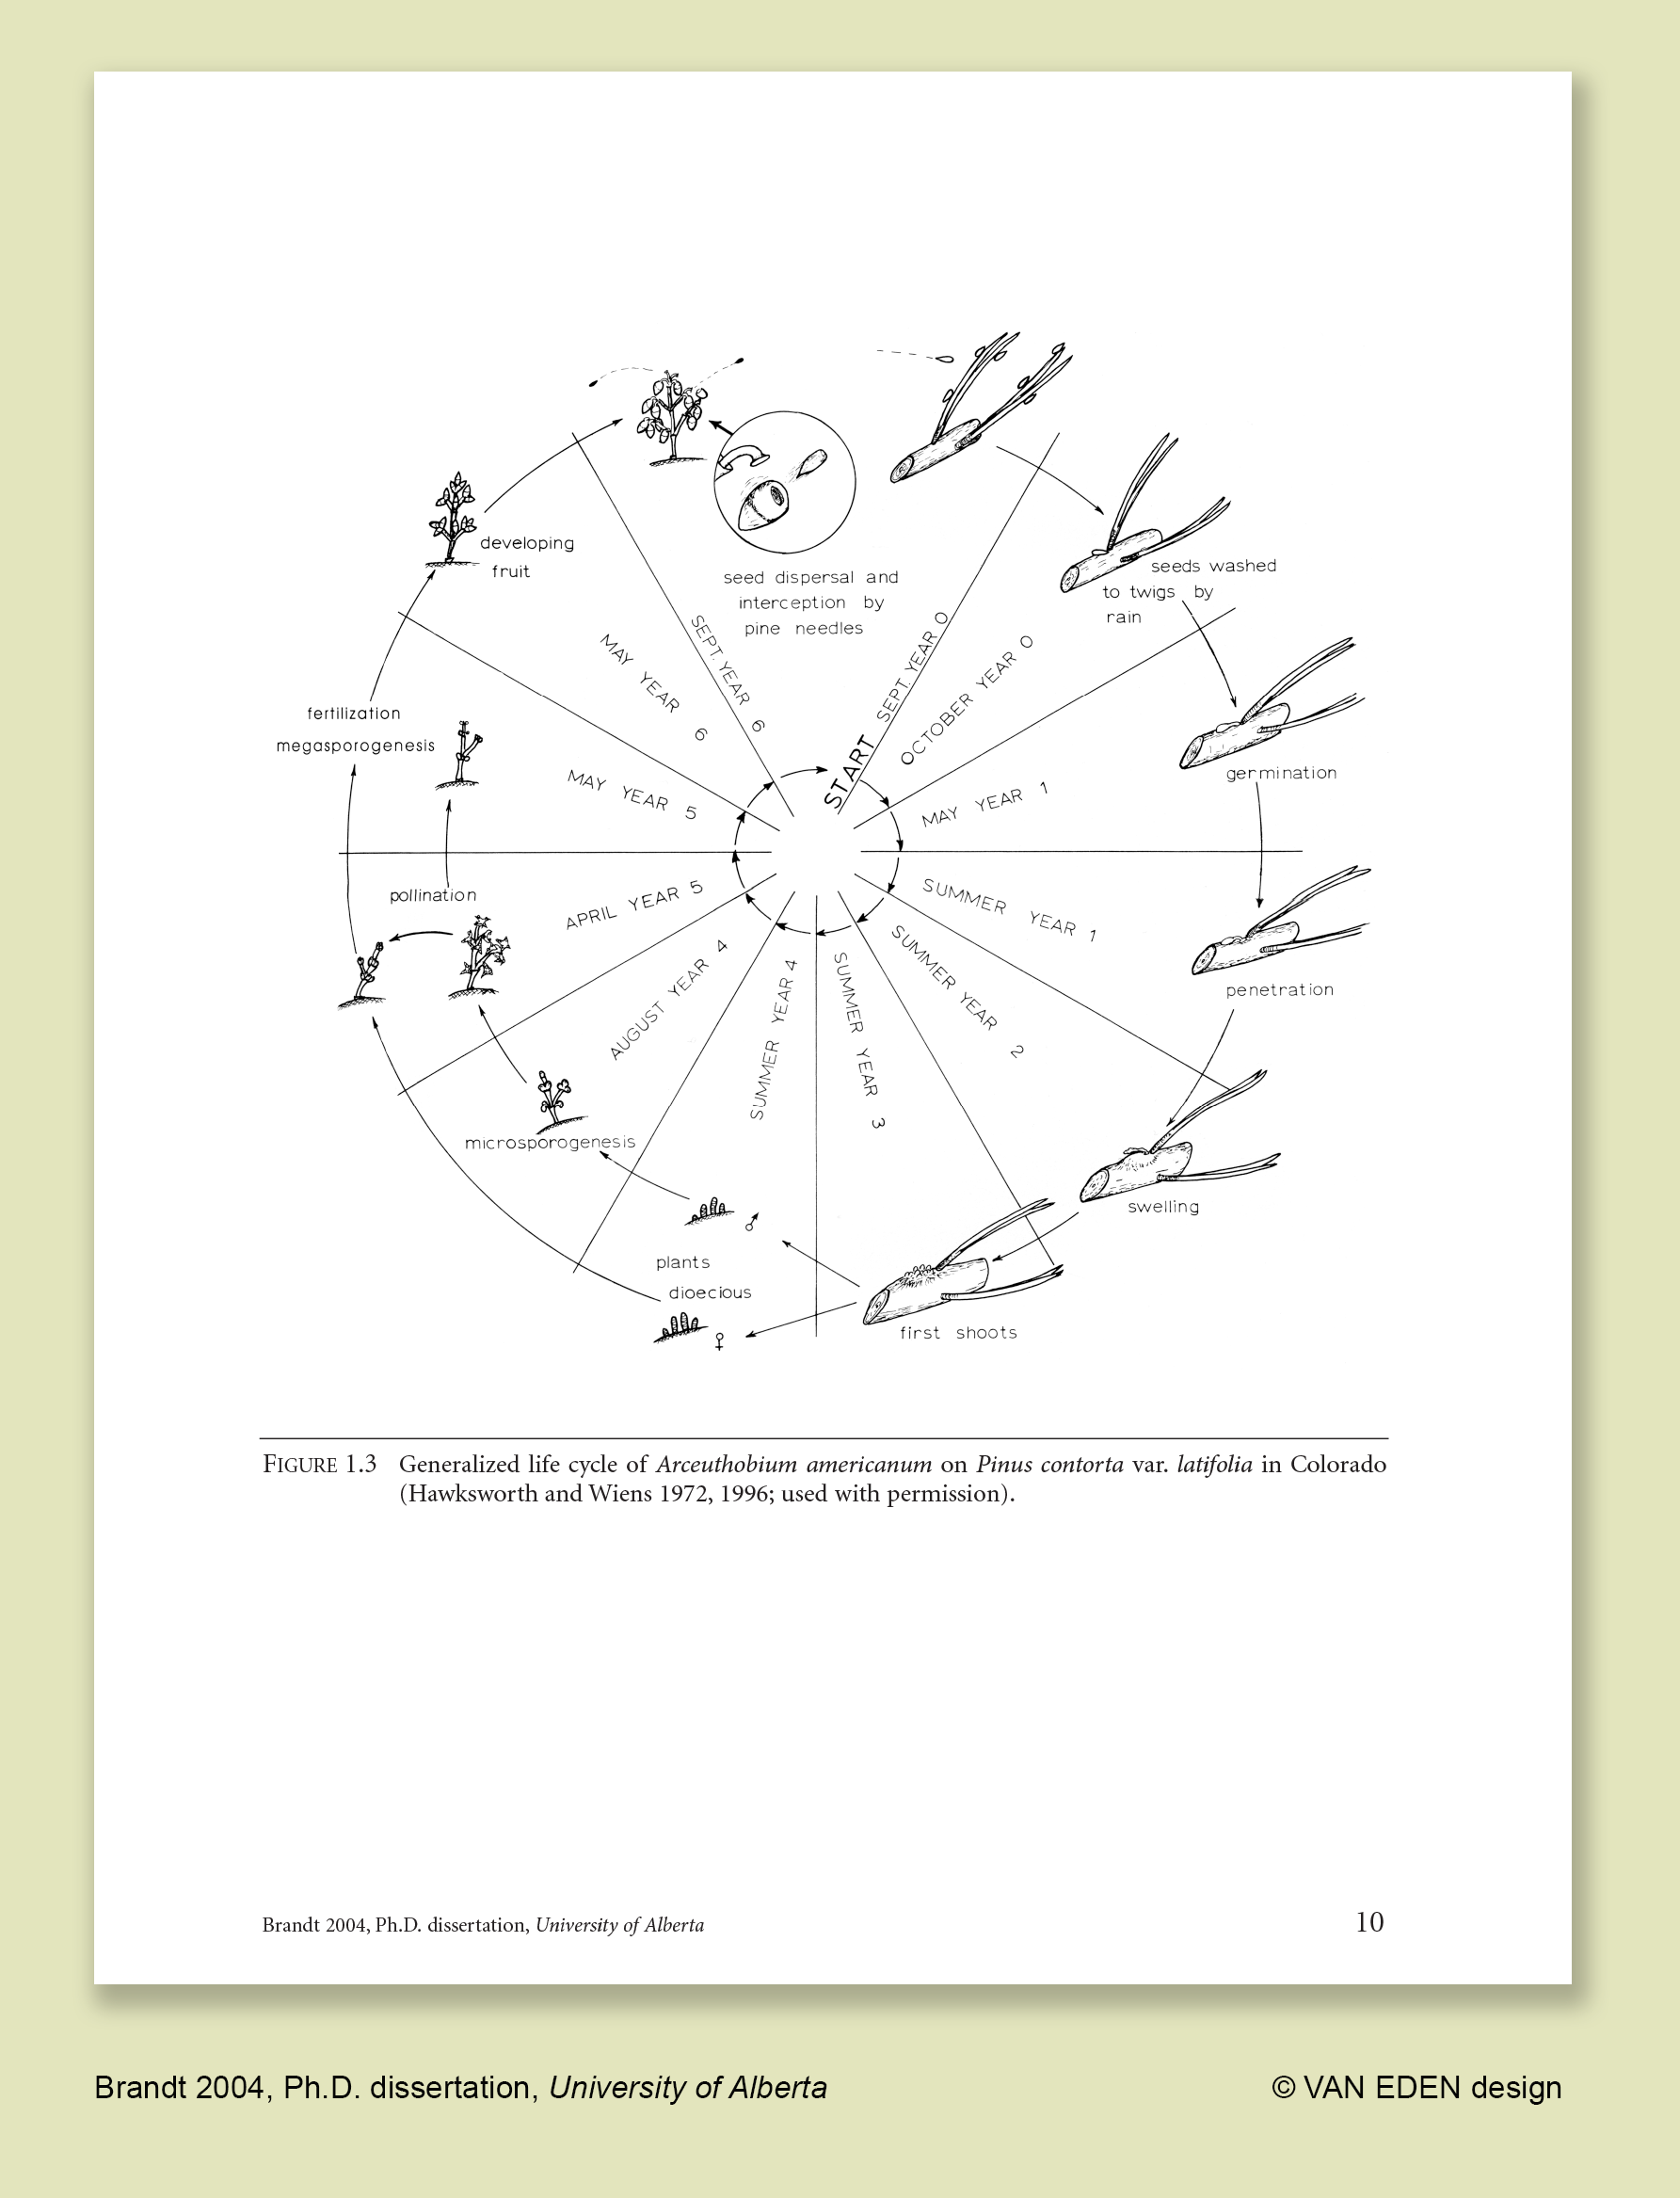
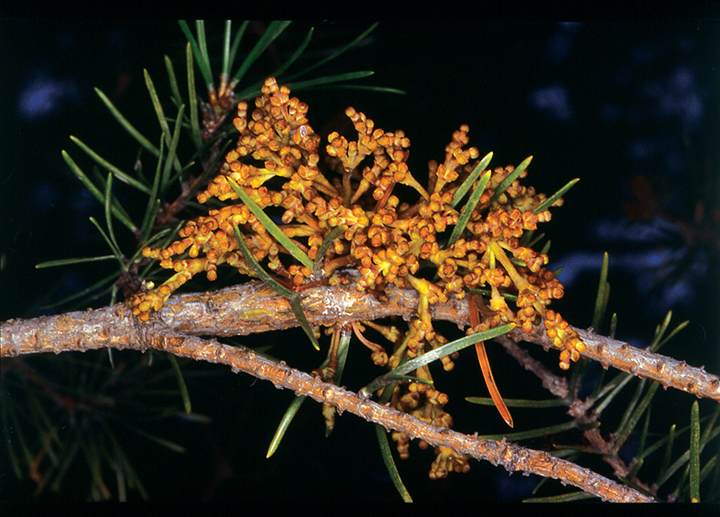
In the dissertation Biology of the Dwarf Mistletoe, Arceuthobium Americanum Nutt. Ex Engelm., on Jack Pine in Alberta, Canada by James P. Brandt, I designed a life cycle diagram (Figure 6.3) to clearly illustrate how this parasitic plant develops over a 60 month period. Different from the diagram by Hawksworth and Wiens in 1972, 1996 (Figure 1.3); the new life cycle diagram uses larger, more detailed plant illustrations and more legible typography. The bold, dark arrows containing the titles at key points in the plant's development clearly show significant events. Comparing the two diagrams shows how a designer can use scale and emphasis to improve the understanding of scientific information. Edward R. Tufte's book The Visual Display of Quantitative Information is a great resource for tackling information design problems.
VAN EDEN design
Visual Communication Design